The 2023 Diversity Baseline Survey (DBS) was created by Lee & Low Books with co-authors Laura M. Jiménez, PhD, Boston University College of Education & Human Development Language and Literacy; Betsy Beckert, PhD candidate, Boston University College of Education & Human Development Language and Literacy; Rory Polera, data analyst; and Jake C. Dietiker, undergraduate, Boston University College of Engineering.
INTRODUCTION
The Diversity Baseline Survey was created to answer a question: Does the book industry have a diversity problem? A benchmark to measure the demographics of the publishing workforce was missing from the larger conversation about representation in books. First executed in 2015 and then in 2019, the Diversity Baseline Survey has become an industry standard, providing a way to track whether publishing’s inclusive hiring practices are working. See data from the previous studies—2019 and 2015—for comparison.
Employers are routinely vociferous about their commitment to Diversity, Equity, Inclusion (DEI) initiatives without implementing the transparent means to monitor results. We know institutional change takes time to bear fruit, which is why revisiting the survey every few years is so vital.
WHY DOES DIVERSITY IN PUBLISHING MATTER?
People from all backgrounds are demanding to see themselves in media. Thanks to the Cooperative Children’s Book Center at the University of Wisconsin-Madison, we know there are more diverse children’s and young adult books being published today. We also know the book industry’s power as a form of cultural expression and as a tastemaker. Television, film, and theater are influenced by publishing trends and successes. It has been heartening to see diverse casting reflected in the many book-to-screen adaptations—irrevocably altering who is seen and heard.
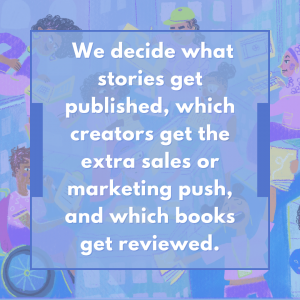
It’s imperative the publishing workforce continues to reflect the many lived experiences in North America. As gatekeepers, we decide what stories get published, which creators get the extra sales or marketing push, and which books get reviewed. Our industry greatly benefits from a diverse workforce to shape the voices and characters that will appeal to a wide audience.
While the 2023 Diversity Baseline Survey results still indicate a majority workforce of straight, nondisabled, White women, there are noticeable percentage changes across various categories. For example, when the DBS was first administered in 2015, 79% of the respondents identified as White. In 2023, 72.5% identified as White. This marked improvement shows that the publishing industry is becoming more inclusive, albeit incrementally so.
THE LAST FOUR YEARS
To say a lot has happened since 2019, when the last DBS results were released, is an understatement. In the US, the political climate feels increasingly polarized as we fight to preserve our democracy. As global citizens, we also bear witness to geopolitical instability and violence from all corners of the planet. These events, among many others, have shaped our worldview:
- The COVID-19 pandemic killed over 7 million people and temporarily shut down the world.
- People worldwide rose up to protest state-sanctioned violence and racial injustice in the wake of George Floyd’s murder by police.
- The US Supreme Court issued judgments ending affirmative action and the federal right to abortion.
Within our industry, important conversations are changing the landscape:
- Grassroots organizations People of Color in Publishing and Latinx in Publishing released the findings of their Workplace Racism Survey.
- PEN America also offered its analysis of the industry in its Reading Between the Lines report.
- The American Library Association reported the highest number of attempted book bans since ALA began compiling data about censorship in libraries more than 20 years ago. Many of the books being challenged are by and about people of color and/or who are LGBTQ+.
Please click or hover your cursor over the PDF to reveal navigation options to scroll through the full survey results. The charts include listing of <1% or 0% for the race, gender, and sexual orientation for greater transparency.
View the DBS 3.0 results in ISSUU.
METHODOLOGY AND RESPONSE RATE
Beginning in January 2023, the latest Diversity Baseline Survey took over a year to complete. Almost two hundred companies, of all sizes, from across North America, participated, including 11 review journals, 37 university presses, 62 literary agencies, and 81 trade publishers (including the Big 5). We made a special effort to invite educational publishers, specifically textbook companies, to participate in the survey with limited success. See the full list of participants.
A note about the participant list: When we disseminated the survey, we confirmed the delivery of survey links to each participating company, taking note of the number of responses received. In a few cases, we noticed a zero-response rate, which indicates the company failed to send out their surveys. Whatever the reason for the not issuing of survey links, this may be why we did not see a larger number of responses, despite an increase in the number of participating companies.
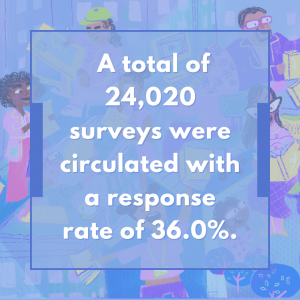
The 2023 Diversity Baseline Survey was sent to 2,591 reviewer employees, 1,860 university press employees, 597 literary agents, and 18,972 trade publishing employees (both children’s and adult divisions of each company). A total of 24,020 surveys were circulated with a response rate of 36.0%. This represents a 10% increase from the number of surveys sent out in 2019, which was 21,753, with 7,893 responses. The current survey had 8,644 responses—a 9.5% increase from 2019.
The DBS was sent directly from each participating company’s internal contact person. To ensure the integrity of the data, we worked with a professional survey company, Toluna, to administer and conduct the survey. Toluna provided blocks of unique survey links based on the number of employees for each participating company to ensure a secure survey. Some participating companies requested universal links, which were easier to send but lacked the security of the unique links. Thankfully, we did not notice or detect any data integrity issues. The surveys were completed anonymously, and no participating company, including Lee & Low, had direct access to the raw data results.
The survey results were analyzed and aggregated by a small team at Boston University to ensure the anonymity of individual respondents. They were the only ones with access to the raw data. Data analysis excerpts from Laura M. Jiménez, PhD, Boston University College of Education & Human Development Language and Literacy, are included below and called out in green italics.
INDUSTRY OVERALL ANALYSIS: WHAT THE NUMBERS TELL US
RACE: According to the survey, 72.5% of publishing, review journal, and literary agency staff are White/Caucasian. The rest are comprised of people who self-report as Biracial/Multiracial (8.4%), Asian/Native Hawaiian/Pacific Islander/South Asian/Southeast Indian (7.8%), Black/African American/Afro Caribbean (5.3%), and Hispanic/Latino/Mexican (4.6%). Native Americans and Arab Americans/Middle Easterners each comprise less than 1% of publishing staff. 0.8% of respondents said their identity was not listed.
The current data around race shows 72.5% of respondents self-identifying as White/Caucasian. There is still an overwhelming White working population in the field, but it is a steady change from 2015 (79% White) and 2019 (76% White).
There are many possible reasons for this change: one that we feel strongly we need to point out is that there is a much larger participant pool with each iteration of the survey. And, with each survey there are more and varied publishers participating. The 6.5% change from 2015 in the racial makeup may also signal an effect of hiring practices, as well as other factors not seen in the data.
The largest change in racial categories was in the biracial/multiracial category at 8.4%, an increase of over 5% from 2019. Overall, the rest of the publishing industry is almost completely unchanged in terms of racial self-identification. Please note that these categories are subjective and overlapping, so there is a total of more than 100%.
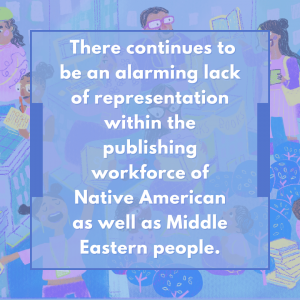
There continues to be an alarming lack of representation within the publishing workforce of American Indian/Alaskan Native/First Nations/Native American (0.1%), as well as Middle Eastern (0.5%). In addition, 0.8% did not identify a race, which is more than either American Indian/Alaskan Native/First Nations/Native Americans or Middle Eastern people.
Black/African representation is holding steady at 5.3%, which is consistent with 2019 (5%) and 2015 (4%). The increase is so nominal that it is not statistically significant. The other group that is holding steady is Asian/Native Hawaiian/Pacific Islander at 7.8%. This, like Black/African representation, has seen a very slight increase over the years from the 7% seen across both 2015 and 2019 surveys. Again, these very slight increases are not enough to be considered statistically significant within this dataset, but the trend is worth noting.
It appears there is an actual decrease (–1.4%) in the people who self-identify as Hispanic/Latino/Mexican at 4.6%. This decrease from both 2015 (6%) and 2019 (6%) is worth attending to across the field. This is enough of a loss to be considered significant.
We reviewed other surveys, along with the US Census, to refine our list of ethnicities for DBS. We received feedback from the previous surveys that some of the race categories were too broad or that subcategories should be separated out, e.g., Pacific Islanders within the Asian category. But we wanted to be able to compare data and avoid any chance of compromising any individual’s personal identifiable information (PII), so we kept the racial breakdowns close to what we offered in the previous survey with a few adjustments.
GENDER: The language around gender identity and sexual orientation is constantly evolving, as is our own personal understanding of where we see ourselves on these spectrums over time. The 2023 survey stats reveal upward trends in how people identify in regard to gender and orientation.
Cis women are still the dominant demographic at 71.3%. This number dips among executive and board member positions to 62.9% identifying as cis women. This reflects the reality that men still ascend to positions of power in significant numbers, even in women-dominated industries.
The 2019 survey reported that overall, 74% of people who work in publishing self-report as cis women. The current survey has 71% of the respondents self-reporting as cis women. Given the sample size difference, this 3% change in cis women does not meet the bar for statistically significant change.
91.9% of publishing staff identify as cis men or women, meaning they identify with the gender they were assigned at birth. The small number of genderfluid, nonbinary, genderqueer people in publishing points to the need for publishers to take extra care with stories about this community, especially if they are written from outside the lived reality of these identities. Accuracy is of the utmost importance when considering how gender identity and sexual orientation have become lightning rods for politicized bias.
SEXUAL ORIENTATION: According to the survey, about 68.7% of publishing staff identify as straight or heterosexual.
This category saw the most change over the course of the study. In the initial survey in 2015, 88% of the respondents self-reported as straight. This survey saw a statistically significant negative change in the number of respondents that self-reported straight. The change can be largely attributed to the number that identified as bi and/or pansexual (14%). Not surprisingly, most of these are White women, but that again is most likely attributed to the fact that the field is overwhelmingly White women. Gay representation held steady at 4%, and lesbian representation increased 1 point to 3%, with asexual increasing to 3.8% from the 2019 results.
As LGBTQ+ civil rights have become more at risk from targeted attacks, the inclusion of this segment of the workforce is more critical than ever. According to the Human Rights Campaign, employees are almost five times more likely to want to work at a company if it publicly supports and demonstrates a commitment to expanding and protecting LGBTQ+ rights. Check out HRC’s LGBTQ+ Corporate Citizen Framework for more insight.
DISABILITY: Disability advocate Ace Ratcliff helped with the construction of this question. While it does lack nuance—because it is a yes or no question—its simplicity may have led to more people self-identifying as having a disability.
The greatest change is seen in disability status. In 2019 11% identified as having some kind of disability. In 2023 16.2% identify as being disabled. It should be of note that the COVID pandemic occurred between the collection of these two data sets.
Literary Agents identified the most as disabled, increasing from 9% to 22.4%. There were statistically significant increases across other departments: Marketing & Publicity rose from 10% to 20%; Editorial from 12% to 18.9%; Reviewers from 19% to 26.2%; and Interns from 22% to 27.6%. The uptick in folks identifying as disabled may be related to the greater availability of remote and hybrid work.
AGE: This is a new question added to the 2023 DBS. According to the US Census, the country’s population is growing older. The majority age in the publishing industry is 25–34 years old (30.9%), illustrating publishing’s workforce is relatively young since the median age in many states is over 40. From there, the ages are as follows, in descending order: 35–44 years old (24.5%); 45–54 years old (20.2%); 55–64 years old (14.7%); 18–24 years old (4.9%), and 65+ years old (4.8%). The unique life experiences that come with a certain age sometimes shifts our thinking and behavior. Young people are often seen as leading the charge when it comes to social change. As those under 40 move up through the ranks, it’ll be interesting to see the impact on the other identity demographics.
PRIMARY WORK LOCATION & REGION: These questions about work location and region were also new for the 2023 DBS. We felt this was important to ask since employee work location has the potential to change the composition of the publishing workforce, allowing it to be more demographically diverse. Overall, the data showed most folks are working in a hybrid environment (48.0%) or entirely remote (45.2%).
Publishing has historically been New York City centric. The pandemic may have shifted this. Most of the industry still works from the US Northeast (58.7%). The US Midwest (15.1%) and US West (9.3%) round out the top regions.
Remote work could also alter future employee makeup from a socioeconomic perspective. More employees than ever before work remotely from locations across the country and Canada. If employees continue to work remotely, a larger cross section of prospective candidates will be able to afford to work in publishing despite its modest salaries without having to relocate to an expensive city like New York.
DEPARTMENTAL OBSERVATIONS
The 2023 survey results provide filter responses by department:
- Executive (includes Board Members)
- Editorial (includes E-book Development and Journals Department)
- Sales (includes Fulfillment/Distribution and Book Fairs/Book Clubs)
- Marketing and Publicity (includes Book Reviewers* and Design)
- Literacy Specialists
- The Business of Publishing (includes Administrative/Customer Service; Human Resources; Information Technology/Website/Metadata; Literary Agents*; Operations/Accounting/Finance; Production/Manufacturing; and Subrights and Permissions/Legal/Contracts/Licensing)
- Interns
- Breaking it down this way gives us a clearer picture of how inclusive or homogenous departments are in relation to one other.
Two new groupings—Literacy Specialists and Business of Publishing—were added to better reflect the variety of work being done.
*These roles in past surveys were their own category with their own pie graphs, respectively. In this survey, our academic analysts grouped Book Reviewers under the Marketing and Publicity umbrella and Literary Agents under the Business of Publishing. There are close-up charts that pull out the demographics for these influential gatekeepers, so the data can be easily compared to previous results.
A few interesting department-level observations worth noting:
MORE DIVERSITY IS STILL NEEDED AT THE TOP: The Executive level continues to see slight changes in demographics, with people identifying as White decreasing.
When we look at race across the different sectors, we see some encouraging trends. The overwhelming whiteness in the Executive levels is trending downward, with the most current data showing 76.7% people self-reporting White. This is only a marginal decrease of 1.3% from 2019, but it is a 10% decrease from the 2015 data.
Comparing data from 2019 to 2023, cis women increased from 60% to 62.9%; the number of people identifying as straight dropped from 82% to 79.6%; and the percentage of people with a disability increased from 10% to 12.4%. Diversity and inclusion only become core values of a business when leadership intentionally chooses to support and invest in a diverse workforce.
EDITORS AND LITERARY AGENTS SHOWED STATISTICALLY SIGNIFICANT CHANGE IN SOME DEMOGRAPHICS: The people in Editorial who self-identified as White lessened. {Editorial shows a downward trend with 71.6% White participants (from 82% in 2015 and 85% in 2019).} This change in just four years is notable. We hope this more diverse pool of editors eases the psychological and emotional burden often placed on the shoulders of the few Black, Indigenous, People of Color around the acquisitions table.
Literary agents were not part of the 2015 dataset. In 2019, literary agents were predominantly White (80%), straight (76%), cis women (84%), who were nondisabled (91%). In 2023, agents are still predominantly White (73.7%), with the largest increase of bi- or multiracial (12.3%) representation. The greatest change from 2019 is reflected in sexual orientation. 62.4% identify as straight (–13.6%), while 23.9% identify as bisexual/pansexual, which is an increase of 10.9%. Along with that increase, there was an increase to the number of people who identify as asexual/demisexual to 4.8% (+2.8%), and a slight increase in those who identify as lesbian at 2.4% (+1.4%).
INTERNS CONTINUE TO BE MORE DIVERSE THAN THE INDUSTRY AS A WHOLE: The Intern dataset offers a glimpse of what the future workforce may one day look like. Of the interns surveyed in 2023, 63.8% identify as BIPOC—up from 49% in 2019; 55.2% are part of the LGBTQ+ community; and 27.6% have a disability.
It appears that the efforts to bring more BIPOC interns into the field has shown enormous promise. Although this is only the second time the category has been included (2015 did not include interns) the growth should be highlighted.
In 2019, 51% of the interns were White, 18% Biracial/Multiracial, 14% Asian/Native Hawaiian/Pacific Islander/South Asian/Southeast Indian, 8% Black/African American/Afro Caribbean, 5% Latinx/Latino/Mexican, 1% Middle Eastern, and 0% American Indian/Alaskan Native/First Nations/Native American; 3% declined to self-identify.
In the current survey the numbers have significantly shifted. 36.2% of the interns self-identified as White, 29.3% as Asian/Native Hawaiian/Pacific Islander/South Asian/Southeast Indian, 15.5% as Biracial/Multiracial, 13.8% as Black/African American/Afro Caribbean, and 5.2% Hispanic/Latino/Mexican. The changes are the most significant for Asian/Native Hawaiian/Pacific Islanders/South Asian/Southeast Indian with a 15.3% increase and Black/African American/Afro Caribbean respondents with a 5.8% increase.
The changes are just as significant across other areas. Although the representation of cis men has remained steady across the years at around 10%, there was a shift in the percent of cis women to 69% (–9%) and an increase in the genderqueer and nonbinary categories. In 2019, genderfluid, nonbinary, and genderqueer were grouped together as a single option for the gender-identity question, making up 9% of interns at the time. But in 2023 we refined the survey to better represent people. There are 8.6% who identify as genderqueer/genderfluid, as well as an additional 8.6% identifying as nonbinary. A total of 3.5% chose not to disclose.
The interns are also serving a much wider array of sexual orientations in 2023, with only 37.9% identifying as straight (–13.1% from 2019). There is also a large change in bisexual/pansexual identity to 25.9% (–4.1%) in the current data. Asexual/demisexual are almost the same at 10.3% (+0.3%), whereas lesbians increased to 12.1% (+7.1%), and those who identify as gay also increased, to 6.9% (+4.9%). Although we did not provide an “other” category, there were 6.9% who elected not to disclose their sexual orientation.
The challenge for the industry will be to both support the wide array of interns who have come into the field and to find a way to retain and promote these individuals in the industry that so desperately needs them.
Internships play a key role in expanding one’s idea of the kind of work possible within an industry. It’s important to remember that Interns temporarily shift the demographics of a company for a set period of time—anywhere from 3 months to a year. An internship does not necessarily easily transition into a full-time entry level role either. While there is no guarantee of permanent placement, the potential exists as companies do routinely hire from the internship pools.
WHAT’S NEXT?
While some of the biggest differences were noted from the 2015 survey results to this latest iteration, the dataset for the first DBS was much smaller than the 2023 version. There’s a shift in attitude about the survey. Companies are more eager to take part in it today than in 2015, when folks needed to be convinced about why it’s important to participate.
Efforts to increase diversity in the publishing workforce will always involve serious work and commitment. The net gain of a more inclusive workforce benefits us all. It lessens the tendency for staff to gravitate toward siloed interactions and increases the likelihood that we will get to know people outside our comfort zone. For the book industry, more diverse representation behind the scenes leads to better books. While the word authenticity has been thrown around over the last few years, the underlying goal should always be to publish books that are genuine and true, and that represent the lived experiences of a wide range of people.
If the publishing industry is sincere about achieving an inclusive workforce, then the people tasked with implementing DEI initiatives should be from a mix of intersecting identities and backgrounds, including those from the majority demographics.
As you digest these latest DBS statistics, please take the time to ponder these questions:
- Is your company culture welcoming of diverse staff?
- Do diverse staff members feel comfortable voicing their opinions? If not, what systems can be put in place that will let them share their thoughts without the feeling of risk or repercussions?
- Have recent conversations on bias and privilege changed your perspective on the systemic problems that exist in society today?
- How can your team, department, or company center the voices of those historically marginalized by the publishing industry to create meaningful institutional change?
- Has your empathy grown or receded toward diverse causes in the last four years? If you have found yourself pulling back, what could be done to bring you back into the fold?
In the words of Dr. Martin Luther King Jr., “The line of progress is never straight.” Four years from now, what will the next baseline survey show us? The work continues.
Contact dbs@leeandlow.com for press inquiries or permission to reprint.