 Jill Eisenberg, our Resident Literacy Expert, began her career teaching English as a Foreign Language to second through sixth graders in Yilan, Taiwan as a Fulbright Fellow. She went on to become a literacy teacher for third grade in San Jose, CA as a Teach for America corps member. She is certified in Project Glad instruction to promote English language acquisition and academic achievement. In her column she offers teaching and literacy tips for educators.
Infographics’ format and economy of words make infographics engaging and accessible to children, reluctant readers, visual learners, and English Language Learners. As infographics contain multiple layers of information, they are a challenging medium for students to practice inferences and interpretation. Lee & Low Books’ infographic series on the diversity gap in major spheres of influence is a valuable vehicle to build students’ visual literacy skills and understanding of diversity. The following discussion questions and suggested activities were created based on the Diversity Gap in the Academy Awards infographic, but these can be applied to the rest of the series.

Discussion questions to consider with your students:
- What patterns do you see? What trends do you see? How are the different charts related?
- What is the central idea of this infographic? How do the words, phrases, and visuals interact to affirm the central idea?
- Based on the infographic, what does “diversity gap” mean in terms of the Academy Awards?
- What might the author’s purpose be in choosing this medium to convey the central idea (to shame, inspire, shock, etc.)?
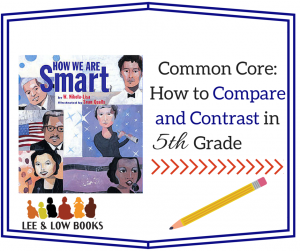 How We Are Smart
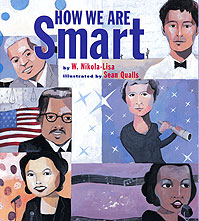
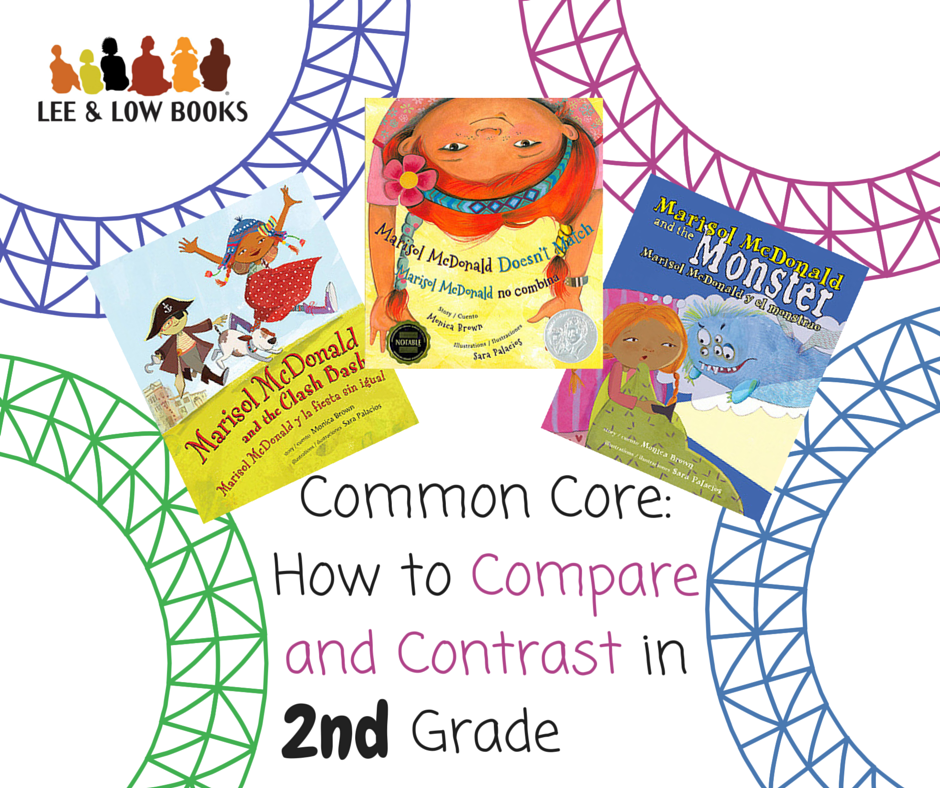
 Through elementary school, readers will learn to compare and contrast within and between texts. By first grade, readers can practice comparing two texts as they continue to learn decoding, sight words, and vocabulary. Comparing and contrasting are useful because teachers can assess students’ abilities at close reading, comprehension, and interpretation, as well as expose even new readers to deeper interactions with a text.
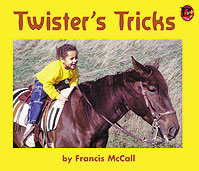
 Last week, I presented
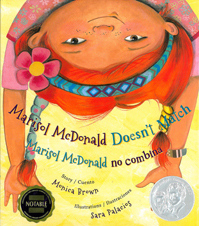
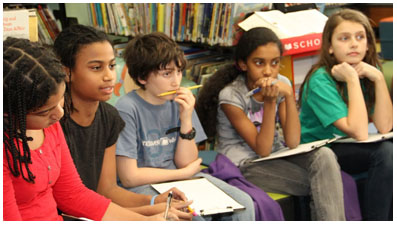
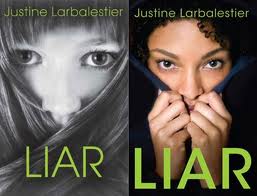
 It started when my co-worker, Jamie Steinfeld, asked me to booktalk some realistic fiction for her sixth-grade Humanities class. A girl asked a question about Return To Sender—“Why is there a bird on the cover?”—and we were off. Good question! Yes, the hardcover does have a bird. And does anyone notice anything about the paperback? See how the boy has his face turned toward us, and we can see his blond hair, but the girl from Mexico has her back to us and we can’t tell what race she is? What’s up with that?

